Backtest your rule without code. See out-of-sample by default.
Rule Collider runs one rule on one symbol across years of broker M5 data, fills on one-minute bars at the prices a demo fleet actually got, charges the spread you pay rather than the smallest spread of the bar, shows what happened on data the rule never saw before it shows anything else, and tells you how many trades it would take before the number means anything.
Research findings
- Every week a miner evaluates about 18,600 rules on 41 CFDs, and about 2,700 survive a full year out of sample. Seven months of trading survivors like these on demo accounts: 9,733 trades at about -0.125 R each.
- Chance alone predicts 87 to 96 percent of the rules that survive a year out of sample.
- A rule’s backtest R per trade had no relation to its live R per trade: rank correlation -0.13.
Research on a fleet of Admirals MT5 demo accounts, March to October 2026; the weekly sweep figures are from the sweep of 30 October 2026. Details in the research posts.
Four things it does that the others do not
Honest.
Every result shows the in-sample figure, the out-of-sample figure and the last quarter, side by side, with the trade count, the standard error, and how many trades it would take to call this R per trade an edge. Below that count the verdict says so, whatever the total. The holdout is enforced by the engine, not by your discipline: the last 30 days are locked for everyone.
Realistic.
Entries and exits resolve on one-minute bars inside each five-minute bar. A pending order fills where demo fills landed, not where the bar touched the level: a per-symbol offset measured on thousands of demo fills, shown on every result. Spread is charged at 1.25 times the bar’s minimum, the factor measured on eight weeks of ticks, with the hours that cost far more marked. Swap is charged per night when a rule holds overnight. Pending orders expire. Results are in R, risk units, not in dollars from a fantasy account.
Expressive.
192 features, not a handful of indicators: volatility percentiles over 20 and 60 days, session and calendar context, the same features on H1, H4 and D1, and cross-asset conditions such as gold momentum while you trade a yen pair. Thresholds come with the feature’s real distribution on that symbol, so you can see what “above 70” means.
Alive.
A saved rule gets re-run as new data arrives and carries a state: net positive, not yet distinguishable from chance, dormant, no edge shown. The weekly Decay Report tells you when a popular rule changed state. Nothing else does this.
How it works
Pick a symbol and a direction.
42 CFDs: US, European and Asian indices, FX majors and crosses, gold, silver, platinum, copper, oil and gas. Long or short.
Describe the rule in plain conditions.
Each condition is a feature, a comparison and a number. “60-day volatility percentile below 0.5.” “Daily RSI above 60.” “Asian range under 0.8 ATR.” “Gold’s 20-bar momentum positive.” Up to five conditions, all of which must hold.
Set the exit and run.
Stop as an ATR multiple, target as a risk-to-reward multiple, optional break-even and trailing, spread cap, no-trade hours, day-end flat or hold overnight. Results arrive in seconds.
The honesty panel
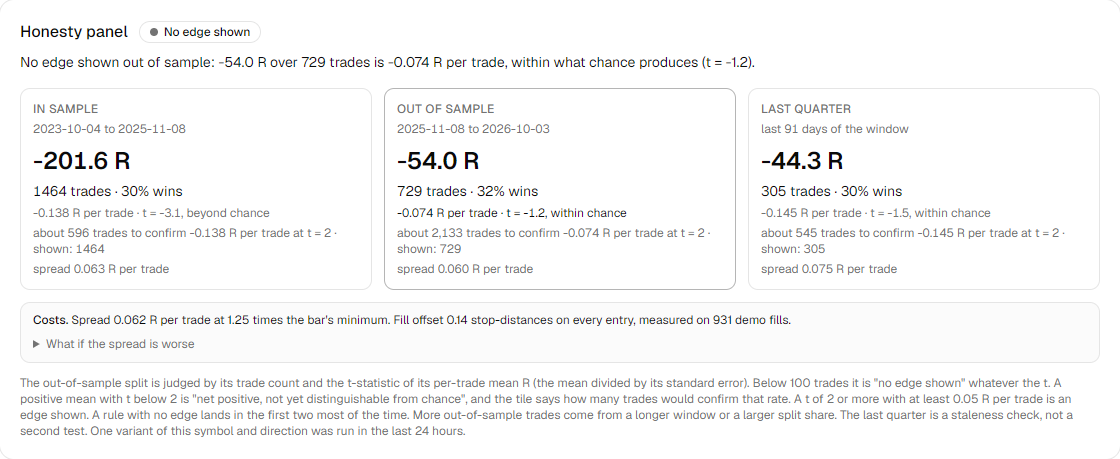
The first thing on every result page. Three tiles: in sample, out of sample, last quarter. Each shows total R, trades, win rate, R per trade, and the t-statistic of the per-trade R against zero. The verdict is a sentence with the numbers in it, such as “Traded 212 times out of sample, +0.11 R per trade, t = 2.3. About 1,000 trades would be needed to call that an edge at this size; net positive, not yet distinguishable from chance; dormant in the last quarter.” Under the cost line: spread 0.07 R per trade at 1.25 times the bar minimum, fill offset 0.12 stop-distances, measured on demo fills. If you've tested more than ten variants of the same symbol and direction in a day, the panel says so. The more variants you try, the more likely one looks good by chance.
What you can ask that other tools cannot
Is 60-day volatility in its bottom half right now?
parkinson_volatility_pct_60d
Is the session’s ATR unusual for this session?
session_atr_z
Is price above the Asian range midpoint?
price_vs_asian_mid
Is the daily trend up on EMA20 against EMA50?
d1_trend_ema20_vs_ema50
Is Brent’s 20-bar momentum positive while I trade CAC40?
x_brent_momentum_20
How is this index moving against the Dow over the last 100 bars?
x_dji30_return_corr
What it is not
Not a signal service. Not advice. Not a broker, and it never places a trade. It does not show candles and it does not export price data. It will not find you an edge: seven months of demo trading say that single-condition indicator rules on five-minute bars rarely have one after the spread. It is a research tool that answers one question honestly: what did this rule do on data it had never seen, is it still doing it, and how many trades would it take to know.
Why it exists
“I wanted to test one rule on JP225 and could not find a tool that did it honestly, so I spent a year building the engine for my own bot. This is that engine with a form on it.”
Then I let that engine mine 18,000 rules a week and traded the survivors on a fleet of demo accounts for seven months. They lost. The autopsy found that the backtester filled orders at prices the market never gave, charged the smallest spread of each bar, and passed survivors that chance alone would have produced. Rule Collider is built so that none of that can happen to you quietly: measured fills, measured spread, and a trade count next to every number.
Plans at launch
| Plan | Price | What's in it |
|---|---|---|
| Free | $0 | One symbol, one year of history, five runs a day, in-sample results only, share links |
| Trader | $29 a month or $290 a year | All symbols, three years of history, out-of-sample split on every result, the full vocabulary, 20 saved rules |
| Pro | $59 a month or $590 a year | Walk-forward validation, Decay Tracker alerts, discovery sweeps, plain-English rule entry, history from 2019, export to a config block |
Waitlist members get a launch discount on the annual Trader plan. Nothing on the vocabulary is ever gated.
Questions
Whose data?
Admirals MT5 bars: five-minute bars for the rule, one-minute bars for the fills, with the spread the broker recorded on each bar times the factor demo fills paid. Most FX pairs and gold from 2000, the US and European indices from 2005.
Why R and not money?
R is the risk on one trade. +0.1 R per trade means the same thing on US100 and on EURGBP. A simulated account with your balance and risk per trade sits under the equity curve if you want money.
Which costs are modelled?
Spread at the fill at 1.25 times the bar minimum, a per-symbol fill offset measured on demo fills, swap per night held including the triple-swap day, a minimum stop distance, pending-order expiry, and an optional one-minute confirmation before entry. No commission, because the broker the data comes from charges none on these CFDs.
Will it find me an edge?
No. It tells you what a rule did on seen and unseen data, whether that is more than chance, and how many trades it would take to know.
Can I get the bars?
No. Every page is derived data: trades, curves and statistics.
When?
Early access goes to the waitlist first, in order of signup.
Join the waitlist
Early access goes out in signup order.